OK, so it’s been almost two months since I’ve run the numbers. It hasn’t been as bad as everybody is claiming so I haven’t been doing the numbers as regularly, but I saw some posts today claiming that the CDC has dropped the Covid-19 deaths from over 150,000 to under 10,000. Keep in mind that the numbers that I’m going off of are only confirmed/reported cases, including for seasonal influenza. Per the numbers below, you are still more likely to die if you get seasonal influenza (6.2% mortality) than you are if you get Covid-19 (3.5% mortality at the worst case, but using the latest revision from the CDC the mortality is as low as 0.112%). I admit that Covid-19 is more contagious because it is new to humans and we have no natural immunity to it, but that is why herd immunity is so important. When enough healthy people get it, recover, and develop immunity while the at risk population self isolates, then the virus won’t really be able to continue to spread because the vast majority of potential hosts will have already developed the immunity (that’s the whole point of herd immunity). My opinion really hasn’t changed toward doom and gloom, even with all the “horror stories” I’ve been reading about this virus. Largely because I’m fairly certain my family has already had it. Read my previous posts for more on that.
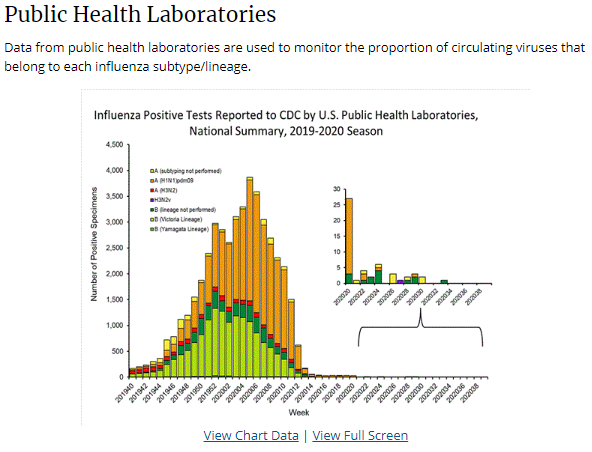
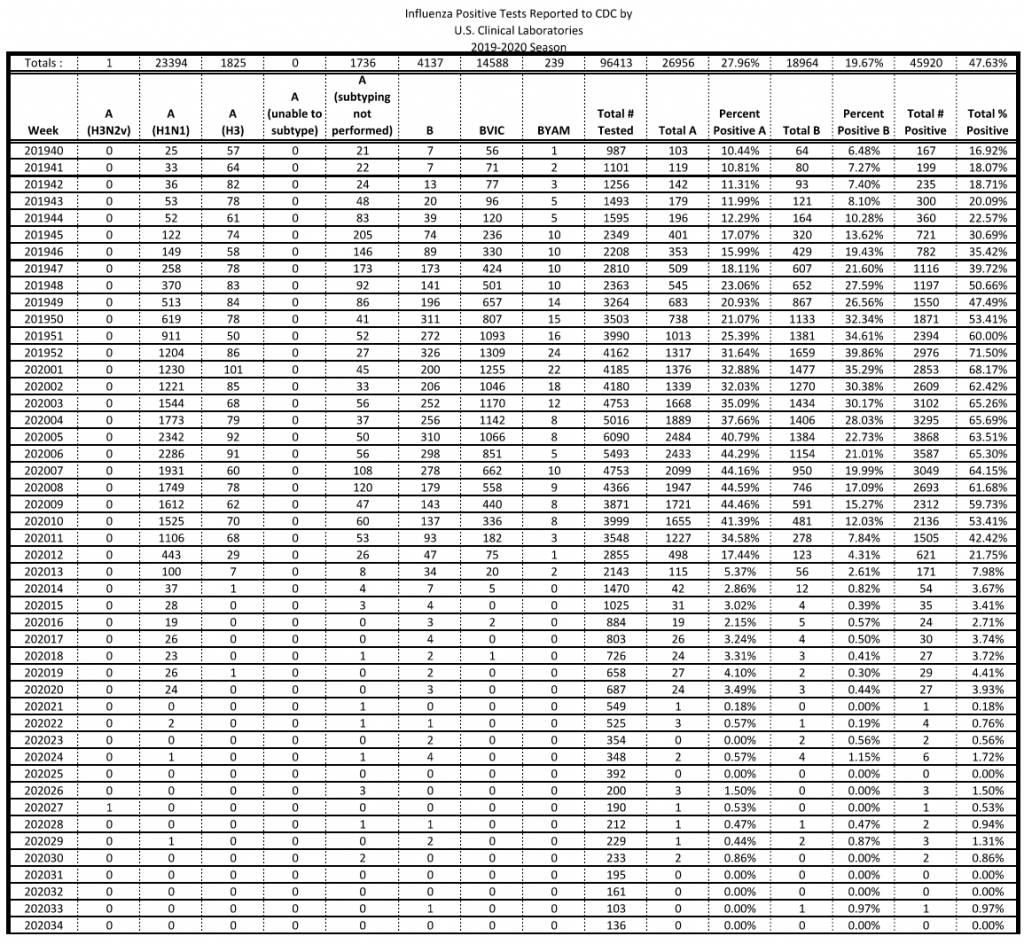
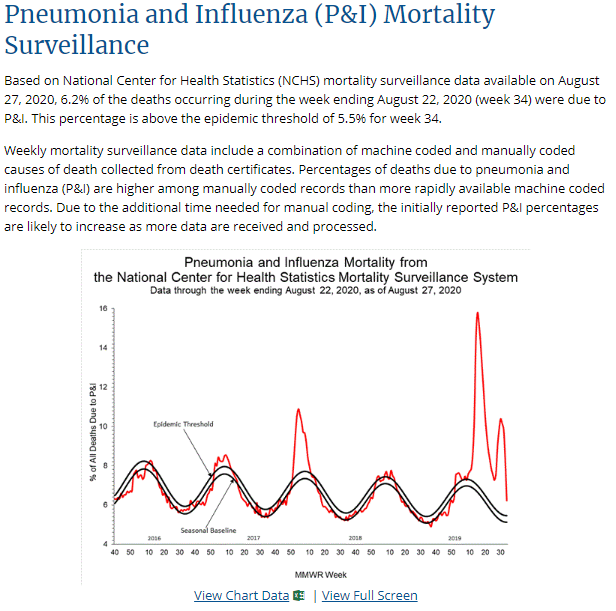
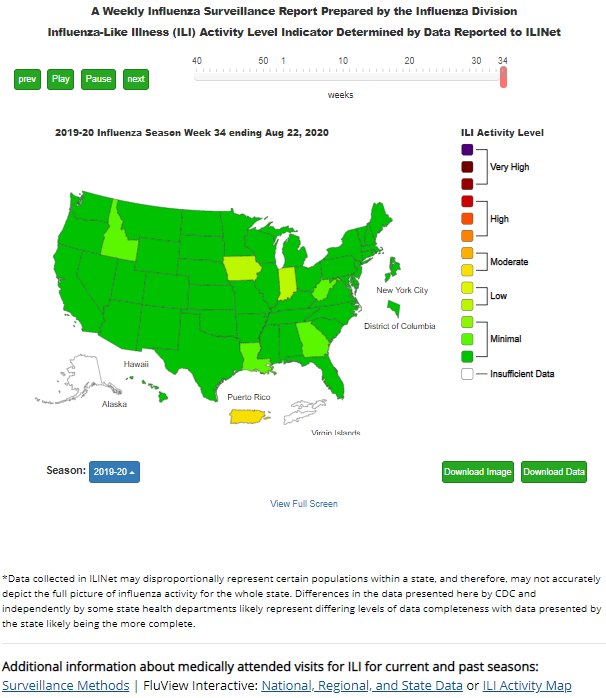
As of August 22, 2020 there were 45,920 cases of seasonal influenza since 9/29/2019 in the US with a P&I Mortality rate of 6.2%. They have changed how the P&I mortality is tracked now, the P&I mortality is now for the week, not averaged over the season. This does not count Covid-19, which does not show up on the standard flu test (if you scroll through the links, you’ll see what types of virus they identify and include in these numbers).
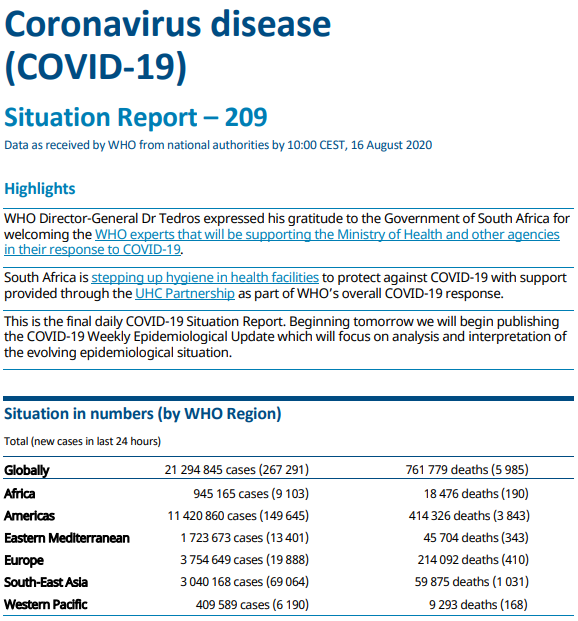
With 21,294,845 total cases and 761,779 total deaths, the Covid-19 Mortality rate Globally is 3.5%. This is from the WHO as of 8/16/2020, 10:00 CET. The mortality numbers are dropping here (was 6.6% back in May).
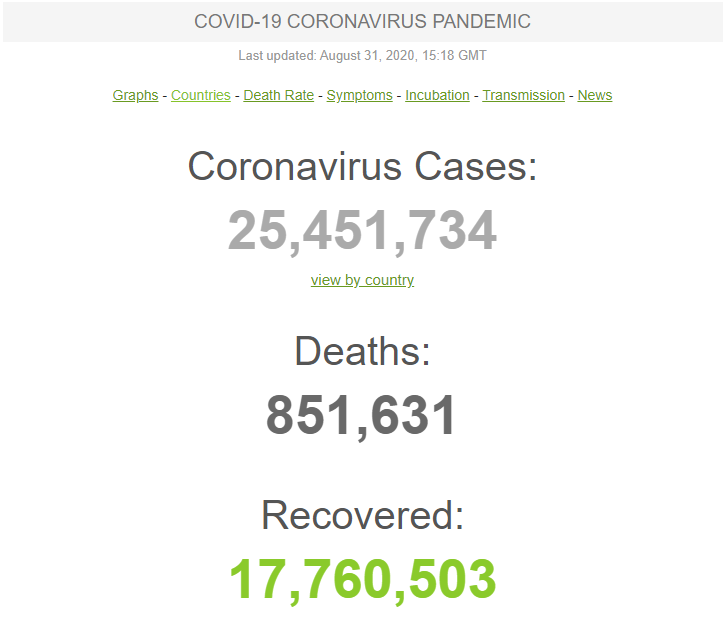
With 25,451,734 total cases and 851,631 total deaths, the Covid-19 Mortality rate Globally is 3.3%. This is from the “worldometer” as of 8/31/2020, 15:18 GMT. The mortality numbers are dropping here as well (was 6.4% back in May).
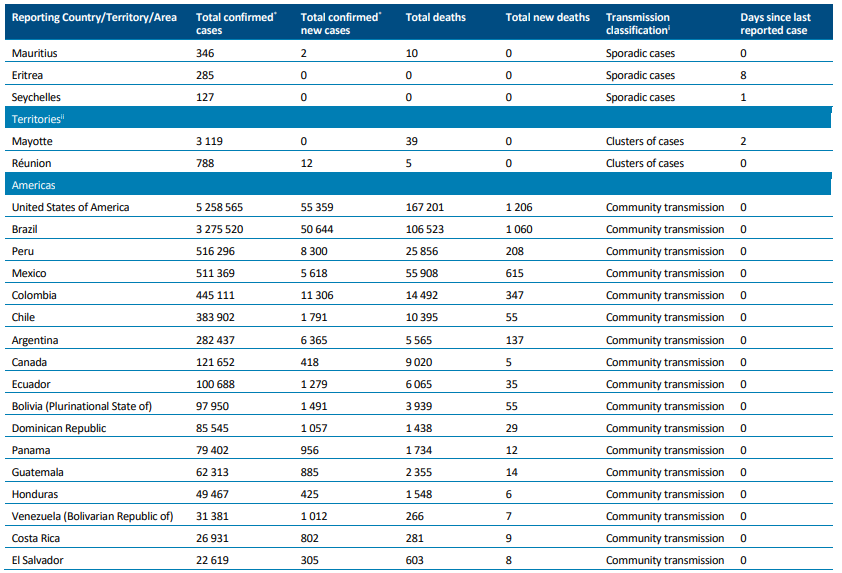
With 5,258,565 total cases and 167,201 total deaths, the Covid-19 Mortality rate in the US is 3.18%. This is from the WHO as of 8/16/2020, 10:00 CET. The mortality numbers are dropping here as well (was 6.01% back in May)
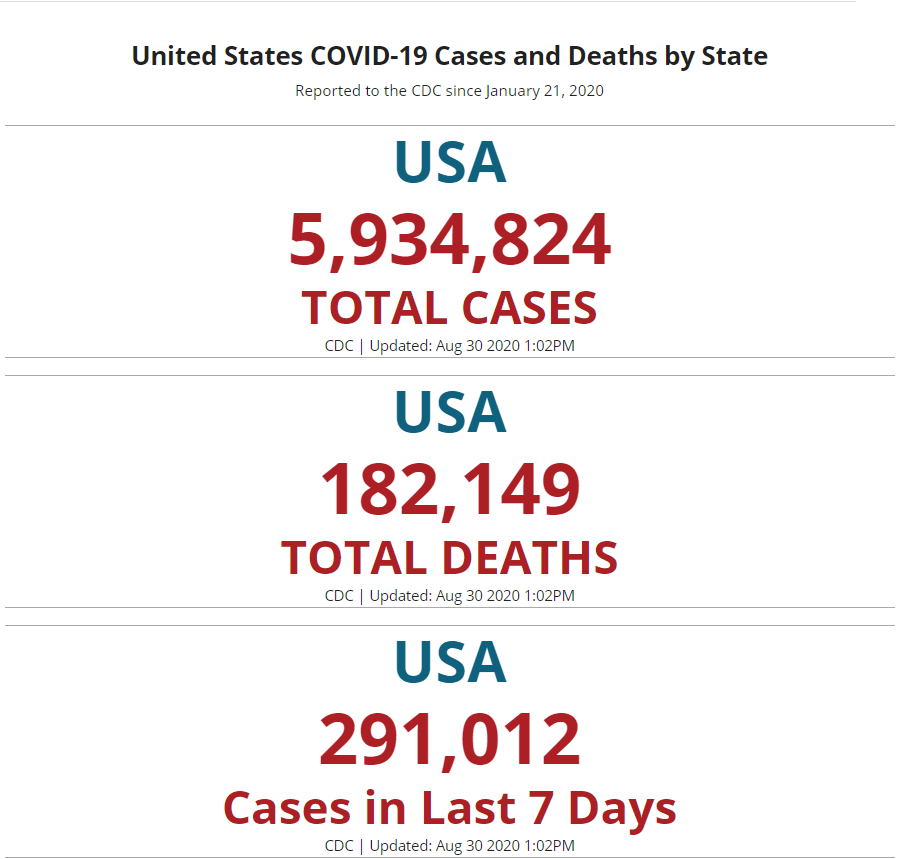
With 5,934,824 total cases and 182,149 total deaths, the Covid-19 Mortality rate in the US is 3.1%. This is from the CDC as of 8/30/2020. If you go to this link and click on “About the Data” you’ll see that these numbers include “both confirmed and probable cases and deaths”. Keep this in mind when you look at the next section.
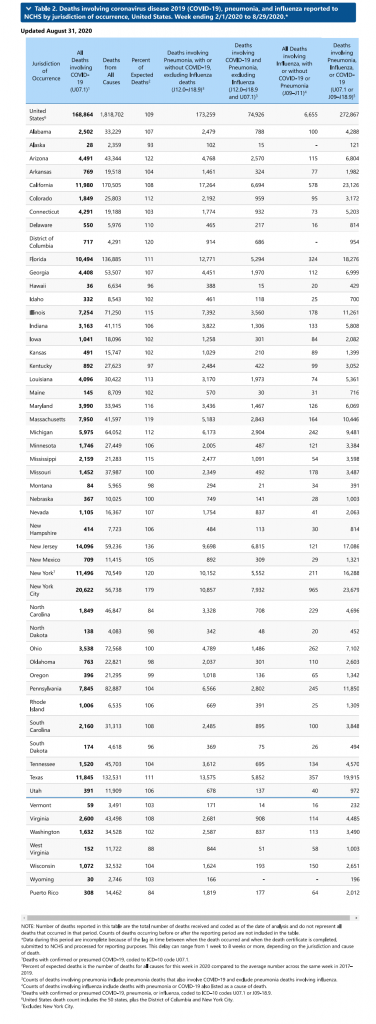
The reason I think this is important to track is because while the numbers above include confirmed and probable cases, there are no comments about updating the numbers as information is received, but this provisional list says “Death counts for earlier weeks are continually revised and may increase or decrease as new and updated death certificate data are received from the states by NCHS.” This makes this list much more believable as it is revised as new information is received. So, the “provisional” numbers state that there are 6,655 total “deaths involving influenza, with or without COVID-19 or Pnemonia, includes COVID-19 or Pneumonia” as of 7/2/2020. If we use this number, that drops the mortality to 0.112%.
Again, this includes ALL INFLUENZA DEATHS INVOLVING COVID-19.
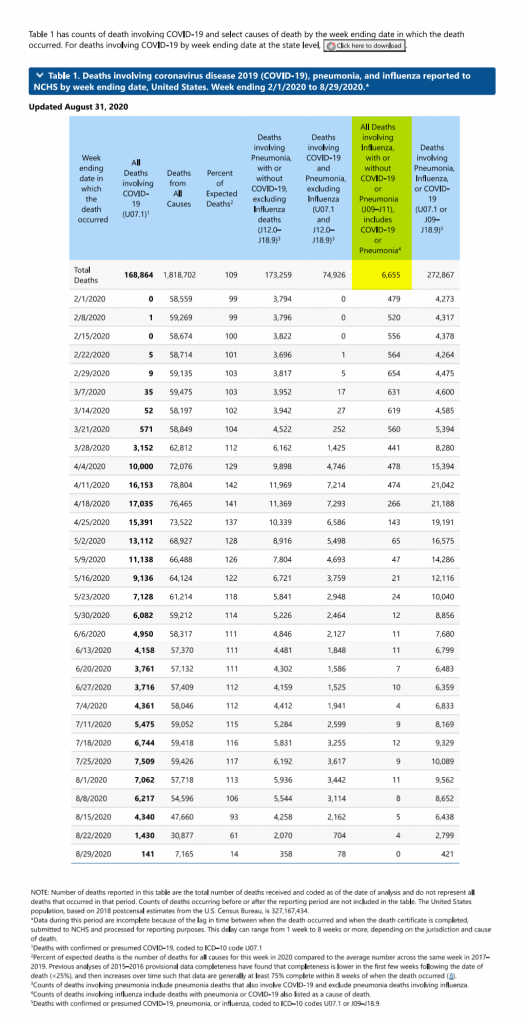
Now, to be fair, I may be interpreting that wrong, so let’s look at this in absolute worst case numbers for all deaths involving COVID-19. 168,864 deaths involving COVID-19 equals a 2.8% mortality. Even looking at it this way, this is MUCH lower than they have been claiming all along.
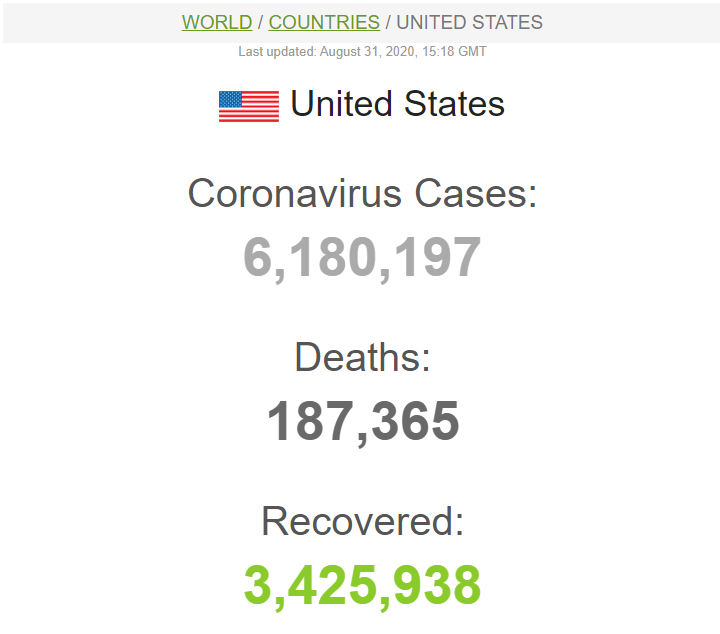
With 6,180,197 total cases and 187,365 total deaths, the Covid-19 Mortality rate in the US is 3.0%. This is from the “worldometer” as of 8/31/2020, 15:18 GMT.
With 116,697 total cases and 2,574 total deaths, the Covid-19 Mortality rate in South Carolina is 2.2%. This is from SC DHEC as of 8/30/2020, 13:00 EST.
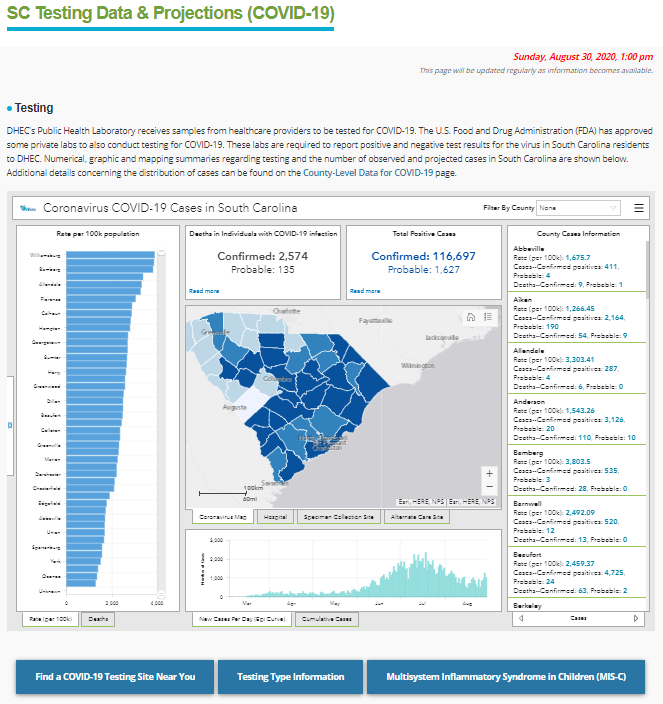
Here are the “provisional” numbers from the CDC… With 100 total influenza deaths (with or without Covid-19), the Covid-19 Mortality rate in South Carolina is 0.086%. This is from CDC as of 8/31/2020. But again, since I could be reading that wrong, the total SC deaths involving COVID-19 is 2,160 which gives us a mortality of 1.85%.
So, the major takeaway today is that the “provisional” numbers are updated as information is received, but the WHO, worldometer, etc numbers are not updated. I’m going to use the “provisional” numbers because they’re correcting assumptions as they get confirmations, rather than just running with the assumptions.
Another thing we need to be reminded of when we’re looking at the numbers is that not all patients presenting with Covid-19 symptoms are getting tested for Covid-19. Most of them are not, whereas pretty much everyone that goes to the dr with flu-like symptoms gets tested for the flu. This is also only “counting” the people that were sick enough to actually go to the dr. We won’t have any idea what the real numbers might actually be until they screen everyone for antibodies, and even then we won’t really know because the antibody tests are notoriously inaccurate.
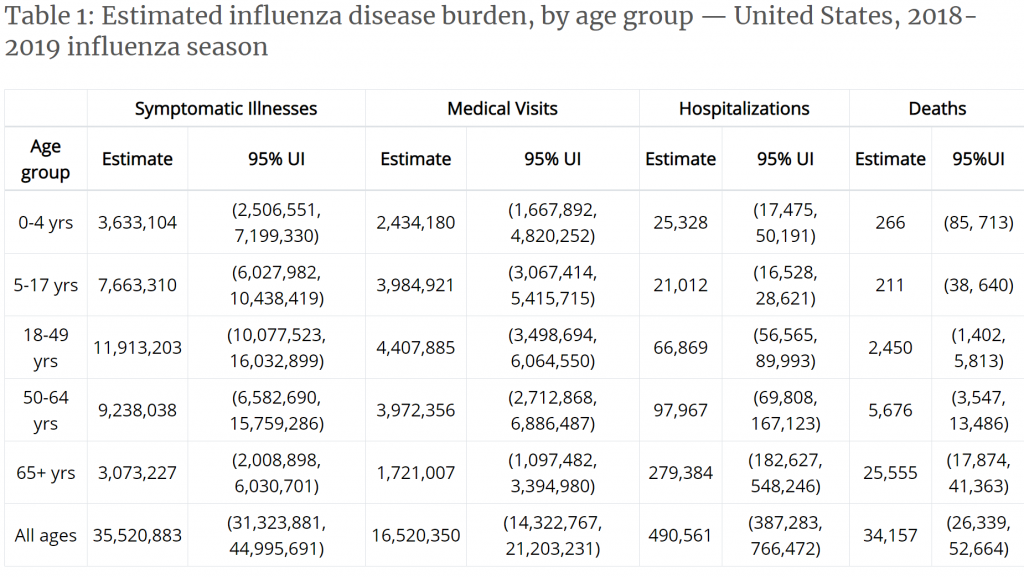
I tried to find numbers for previous years; how many people were tested and how many were positive. I found numbers for positive flu tests, but I didn’t really find numbers for people actually tested. They had numbers for “medical visits”, numbers for “hospitalizations”, and numbers for “deaths”. These charts don’t make much sense to me. I’m going to ponder these charts and see if I can get any understandings. Here’s a link to the 2018-2019 flu season numbers, see what you can make of it.